Dashboard
Intro
Dashboard
The Dashboard provides an overview of key statistics and analytics related to users, pages, and interactions within the system. It is designed to offer quick access to essential data and allow users to search for specific pages or review high-level metrics.
Features
-
Search
- The search functionality allows you to quickly find and filter pages within the system.
- Usage: Simply enter keywords or phrases related to the page you want to find, and the results will display relevant pages.
-
List of Counts
- The Dashboard displays a summary of important entities with counts to give an overall view of activity:
- Users: The total number of users registered in the system.
- Pages: The total number of pages created within the system.
- Page Blocks: The total number of blocks used across all pages.
- The Dashboard displays a summary of important entities with counts to give an overall view of activity:
-
Widgets: Page Analytics Described above.
Summary
The Dashboard provides a comprehensive overview of user and page activity within the system, offering detailed analytics and metrics. It is an essential tool for monitoring performance and user interactions, with customizable widgets for in-depth insights.
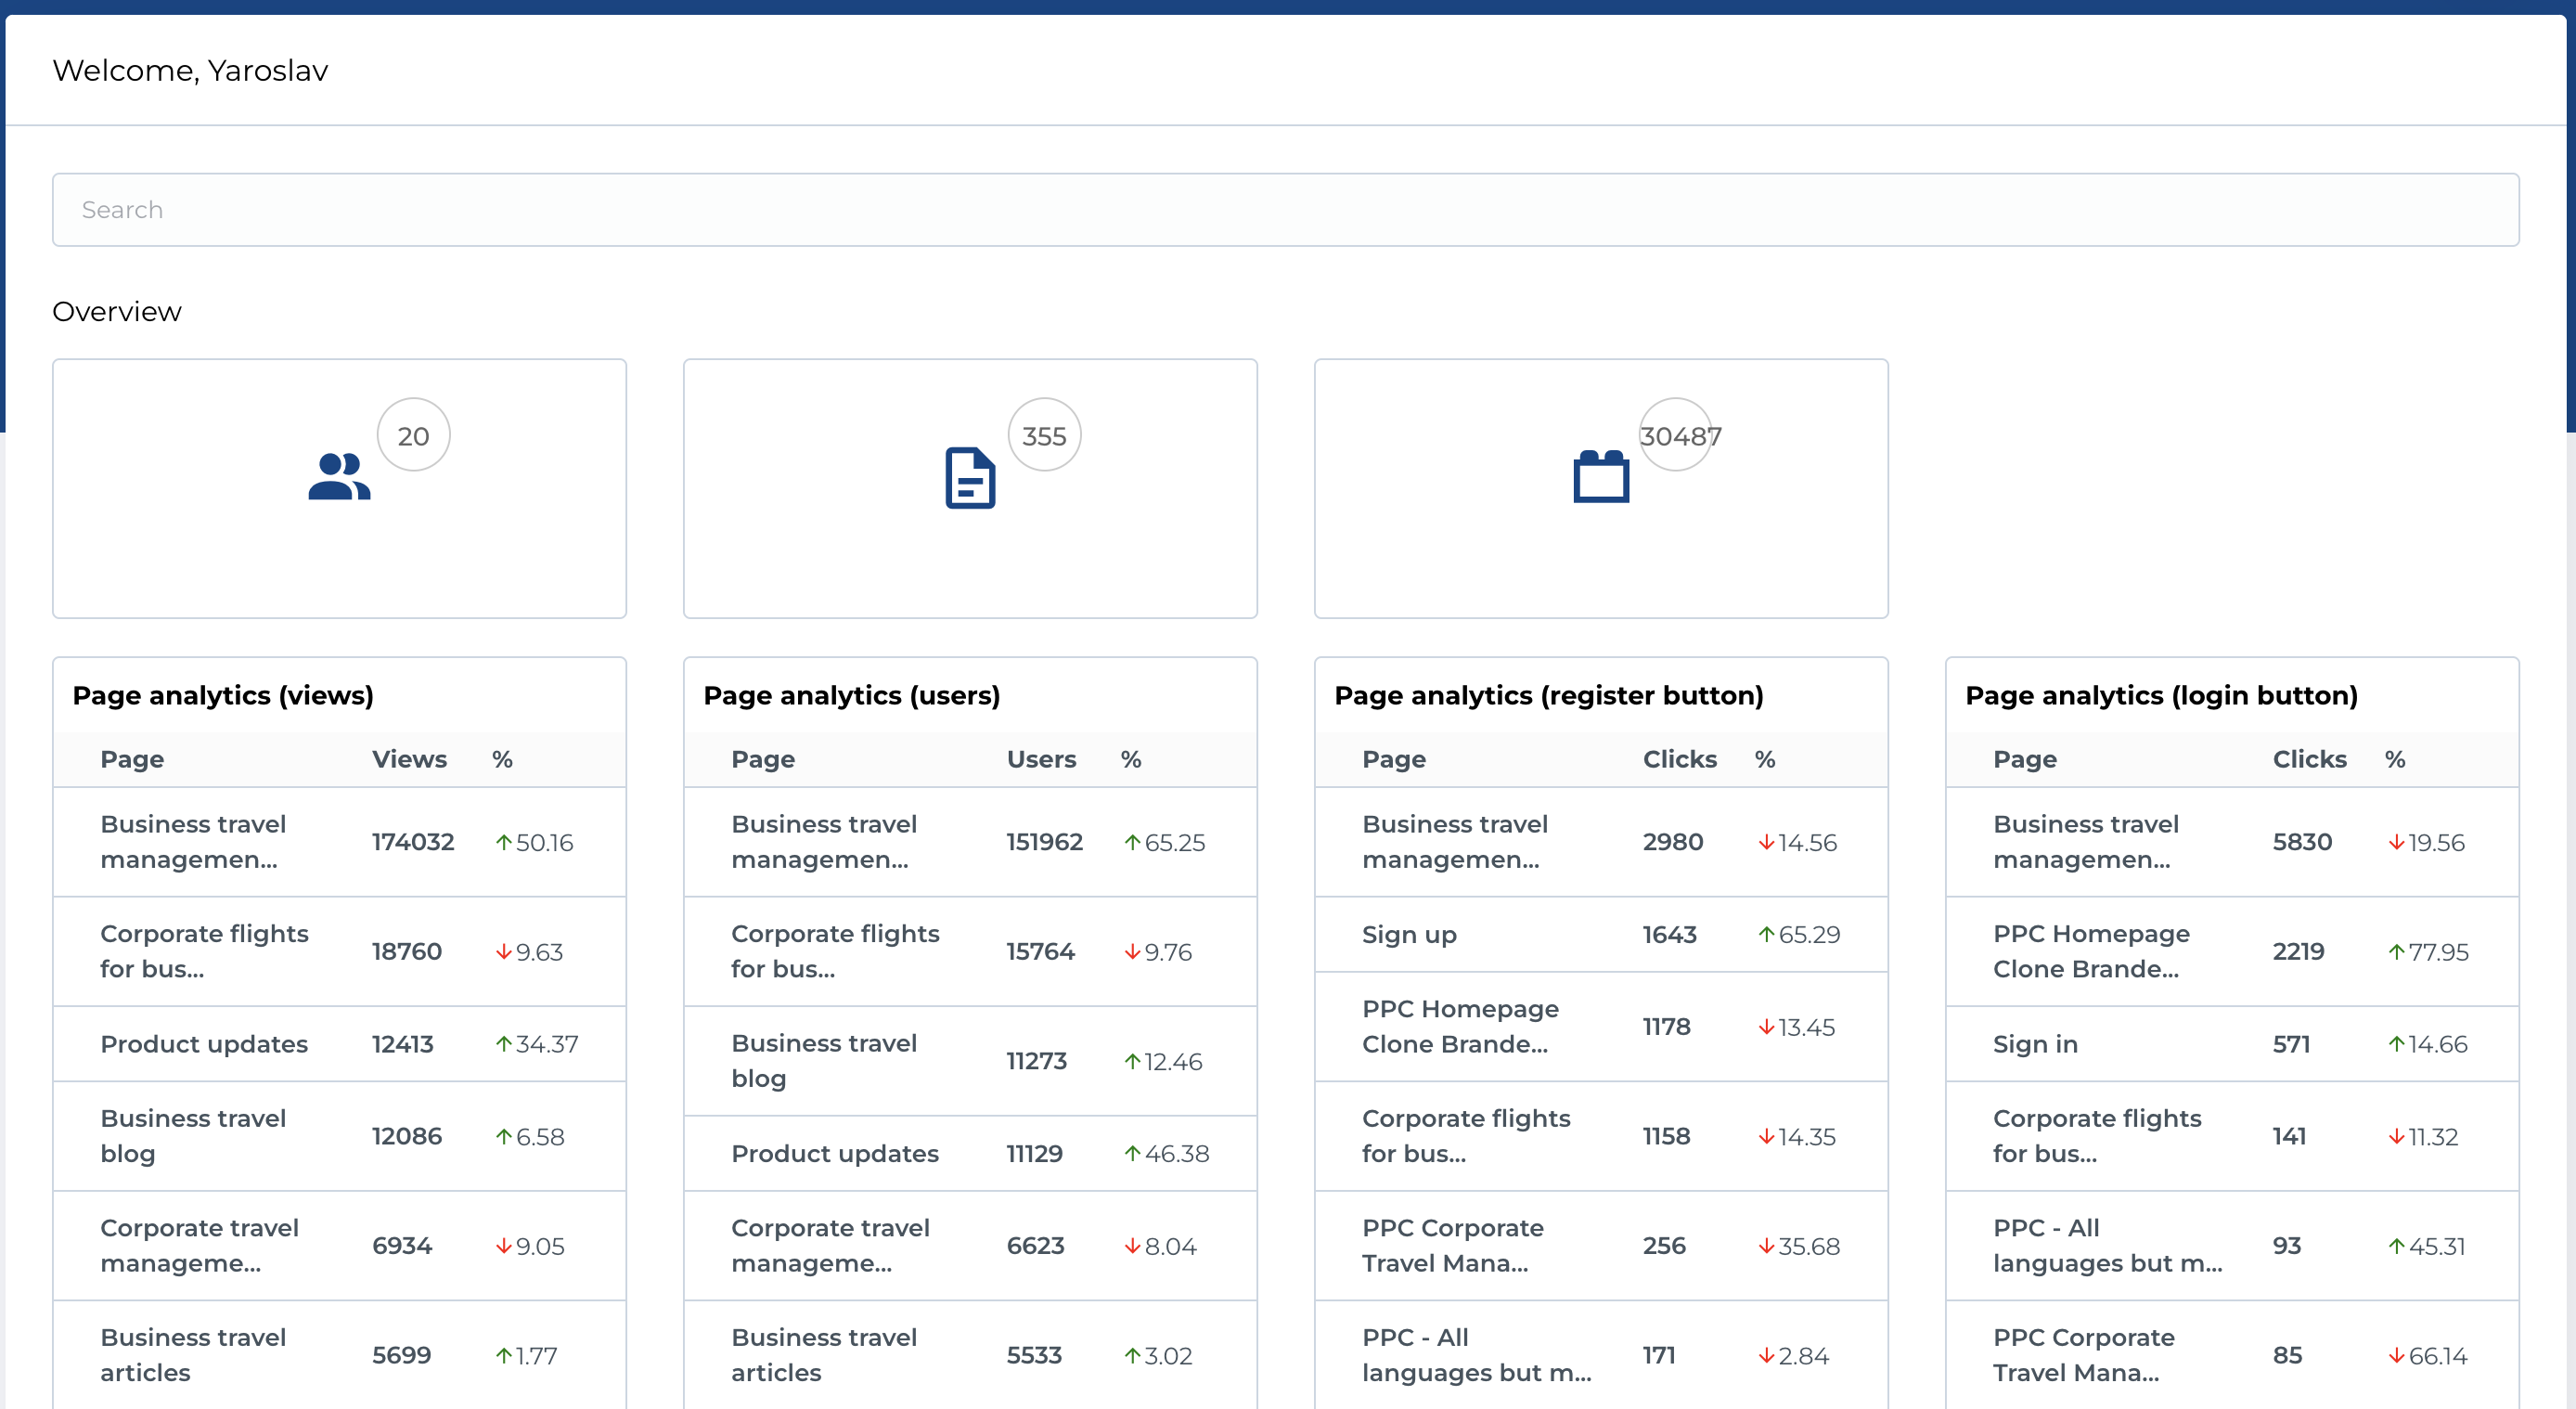
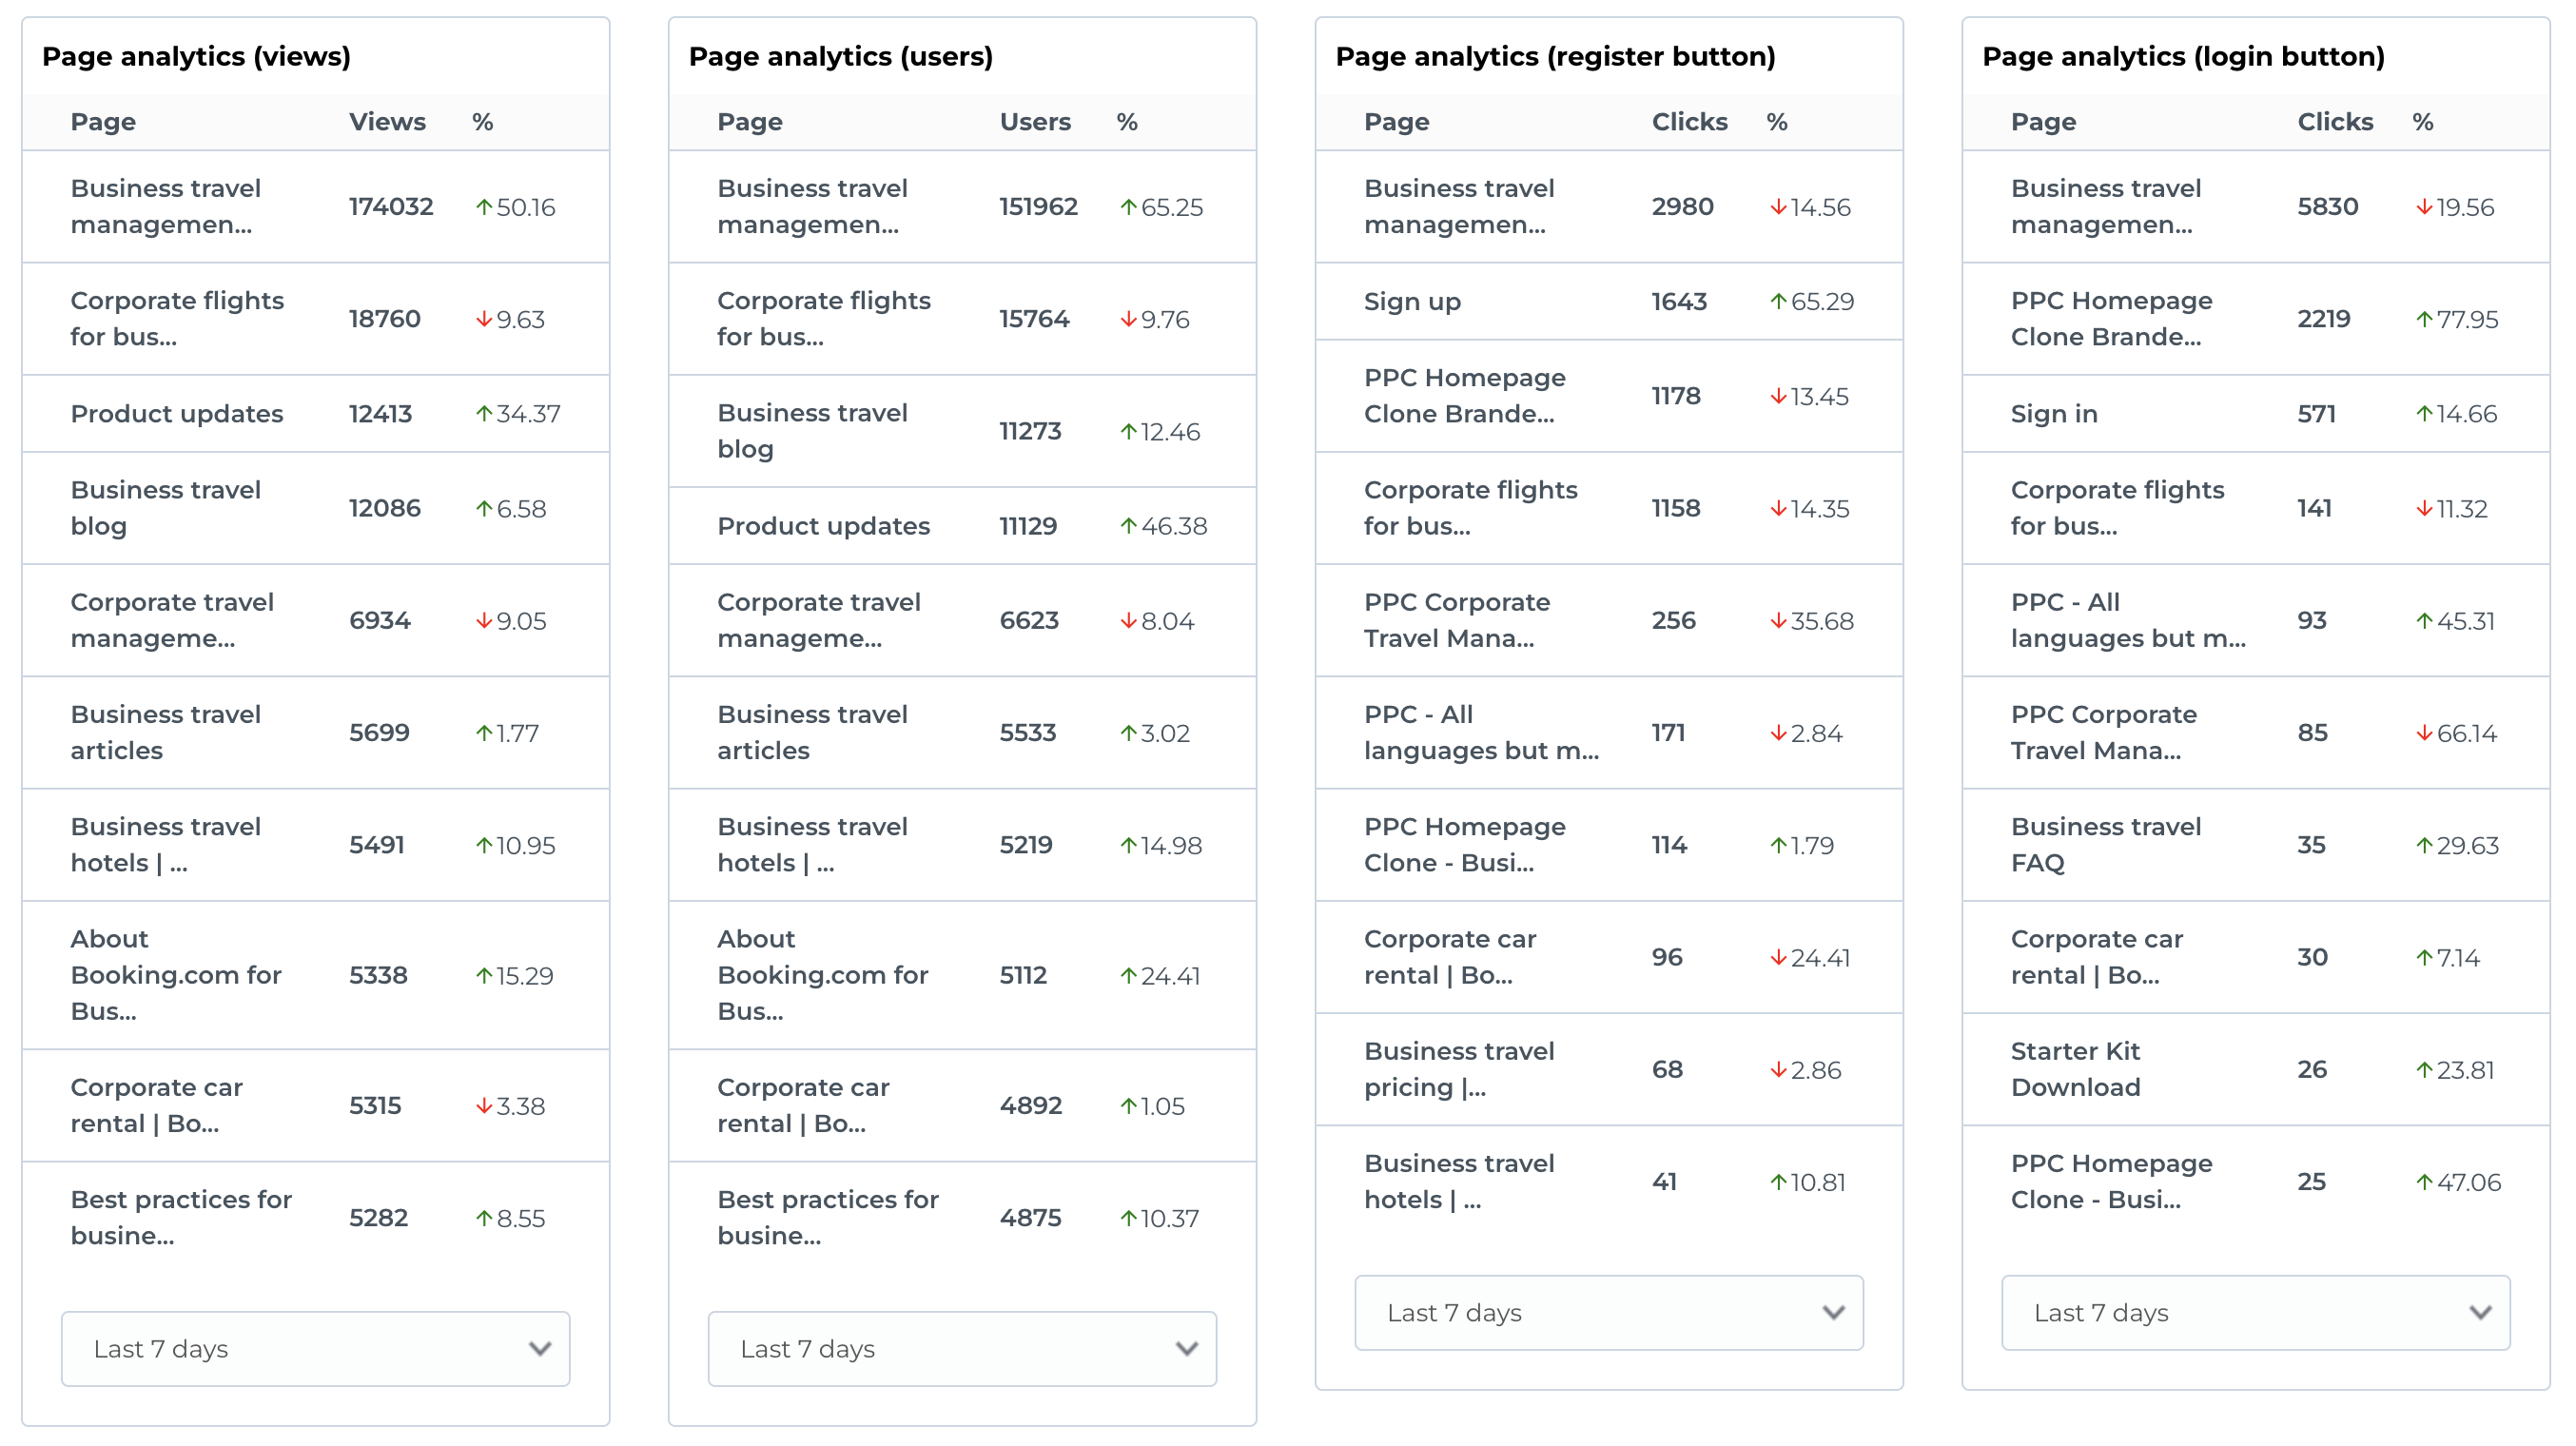
Widgets: Page Analytics
The Dashboard includes four widgets that provide detailed Page Analytics. Each widget offers insights based on selected time periods (e.g., Today, Last 1 day, Last 7 days, Last 30 days) and shows how the metrics compare to the previous period.
Each widget contains the following columns:
- Page: The page that the analytics data corresponds to.
-
Entity (Users, Views, Clicks): The specific metric being tracked. This includes:
- Views: The number of times a page has been viewed.
- Users: The number of unique users interacting with the page.
- Register Button: The number of clicks on the registration button on the page.
- Login Button: The number of clicks on the login button on the page.
- Percents Comparison: The percentage change in the metric compared to the previous selected period. This gives insight into growth or decline in activity.
-
Period Select: Choose a time period for the analytics data, such as:
- Today: Metrics for the current day.
- Last 1 Day: Metrics from the last full day.
- Last 7 Days: Metrics for the previous 7 days.
- Last 30 Days: Metrics for the previous 30 days.
Widget Breakdown
-
Page Views Widget
- Tracks the number of times a page has been viewed.
- Shows how page views have changed compared to the previous period.
-
Users Widget
- Displays the number of unique users visiting the pages.
- Includes comparison to the number of users in the previous period.
-
Register Button Clicks Widget
- Tracks the number of clicks on the registration button across pages.
- Shows the percentage increase or decrease in button clicks compared to the previous period.
-
Login Button Clicks Widget
- Monitors the number of clicks on the login button across pages.
- Displays changes in login button activity as compared to the previous period.